

Vancouver, British Columbia – Crashes are a part of life, especially when you are North America’s third most congested city.
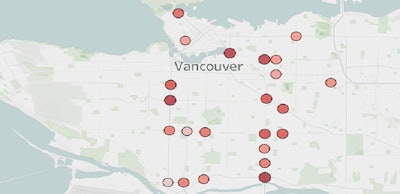
These are Vancouver’s 10 most dangerous intersections excluding on-ramps, according to Insurance Corporation of British Columbia (ICBC) data between 2019 to 2021.
- Knight Street & Knight Street Bridge & Se Marine Drive (290 collisions)
- Granville Street & W King Edward Avenue (281 collisions)
- Main Street & Terminal Avenue (276 collisions)
- Clark Drive & E 1st Ave & Grandview Viaduct (272 collisions)
- E 41st Ave & Knight Street (253 collisions)
- Granville Street & Marpole Ave & W 16th Ave (250 collisions)
- Kingsway & Knight Street (249 collisions)
- Kingsway & Victoria Drive (247 collisions)
- E 41st Ave & Victoria Drive (246 collisions)
- Denman Street & Georgia Street (240 collisions)
Readers of our Toronto collision report may wonder why Vancouver has hundreds more collisions per intersection, compared to Toronto. For context, the Toronto Police Service (TPS) reported 921 collisions in Toronto between 2016 and 2020. In contrast, ICBC reported 55,000 collisions in 2020 alone.
While the 2021 TomTom traffic index lists Vancouver as a solid third in traffic congestion and Toronto trailing back as the 9th worst city out of 93, these statistical differences come down to differences in data collection methods and criteria between the ICBC and TPS, the two agencies responsible for logging collision data in the two cities.
Drivers in Toronto are legally required to report collisions to the TPS when damages exceed $2,000, involve property, injuries, uninsured drivers or criminal activity. In contrast, ICBC includes insurance claims of all extremities, thereby including data from minor accidents that the TPS does not require.
ICBC data includes collisions involving cyclists, who represent between two and three percent of all traffic in Vancouver, according to the Global Bicycle Cities Index by Coya. It is also entirely possible that people are more likely to report collisions for insurance claims, rather than just their civic duty. At the time of publication, ICBC has not responded to a query on the number of Vancouver crashes that fit TPS reporting criteria.
The takeaway? Read the fine print, organizations can gather similar stats for different reasons.
If you like the header image, take a look at ICBC’s interactive collision heatmap from Tableau Public at the following link. Leave a comment and let us know which cities we should look into next!