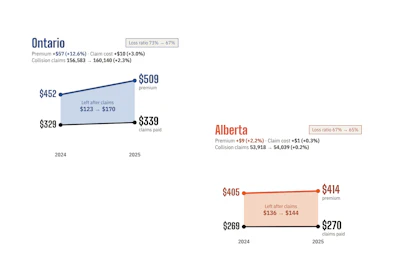

Ontario collision insurance premiums rose 12.6% in 2025 while claim costs increased only 0.5%, creating a significant gap between what drivers pay and actual claim expenses. Alberta experienced a different pattern with minimal claim growth but steady premium increases.
- Ontario collision premiums jumped 12.6% from $451.97 to $508.91, far outpacing claim cost increases
- Ontario collision claims rose modestly at 2.3% while average claim costs edged up just 0.5% to $11,735
- Ontario's collision loss ratio fell from 73% to 67%, meaning insurers retained a larger share of premiums
- Alberta showed restraint with claim counts increasing only 0.2% and frequency declining to 2.41 claims per 100 vehicles
- Claim frequency in Ontario climbed to 2.89 claims per 100 insured vehicle-years, up from 2.82 in 2024
Ontario collision claims rose modestly in 2025 while Alberta’s claim count barely changed, according to provincial insurance exhibits from the General Insurance Statistical Agency (GISA). The figures provide a provincial comparison of collision claim frequency, average claim costs and earned premiums.
Ontario’s estimated collision claim count increased 2.3%, reaching 160,140 from 156,583 in 2024. Claim frequency climbed from 2.82 to 2.89 claims per 100 insured vehicle-years. Average cost per claim edged up just 0.5%, from $11,677 to $11,735. These figures cover collision insurance, which generally responds to at-fault vehicle damage, rather than every crash-related claim.
Premiums moved much faster. Ontario’s average earned premium for collision coverage rose 12.6%, from $451.97 to $508.91. Its collision loss ratio fell from 73% to 67%, meaning incurred losses and loss adjustment expenses represented a smaller share of earned premium. The loss ratio does not account for other insurer expenses or establish overall profitability.
Alberta showed a different pattern. Collision claim counts increased just 0.2%, from 53,918 to 54,039, while frequency slipped from 2.45 to 2.41 claims per 100 earned vehicles. Average claim cost rose 2%, from $10,967 to $11,186. More insured vehicle exposure accompanied essentially flat claim numbers.
For repairers, the distinction matters. Claim counts help describe the potential pool of claims, while frequency shows how often claims arise relative to insured vehicle exposure. Neither measure establishes how many vehicles actually reach a repair facility.
Nor should the average claim figures be read as average repair invoices. The exhibits do not separate repairable vehicles from total losses in these tables, and GISA applies development factors to claim counts and claim amounts to estimate ultimate levels. Separate repairable-claim data is needed to assess repair demand.
GISA’s release tracker, updated Oct. 1, lists available year-end 2025 exhibits alongside mid-year 2026 reports whose release fields remain blank. Readers can access selected provincial reports through its statistical information page.